Blog · 8 October 2026
What is the Sphere standard for people per water point?
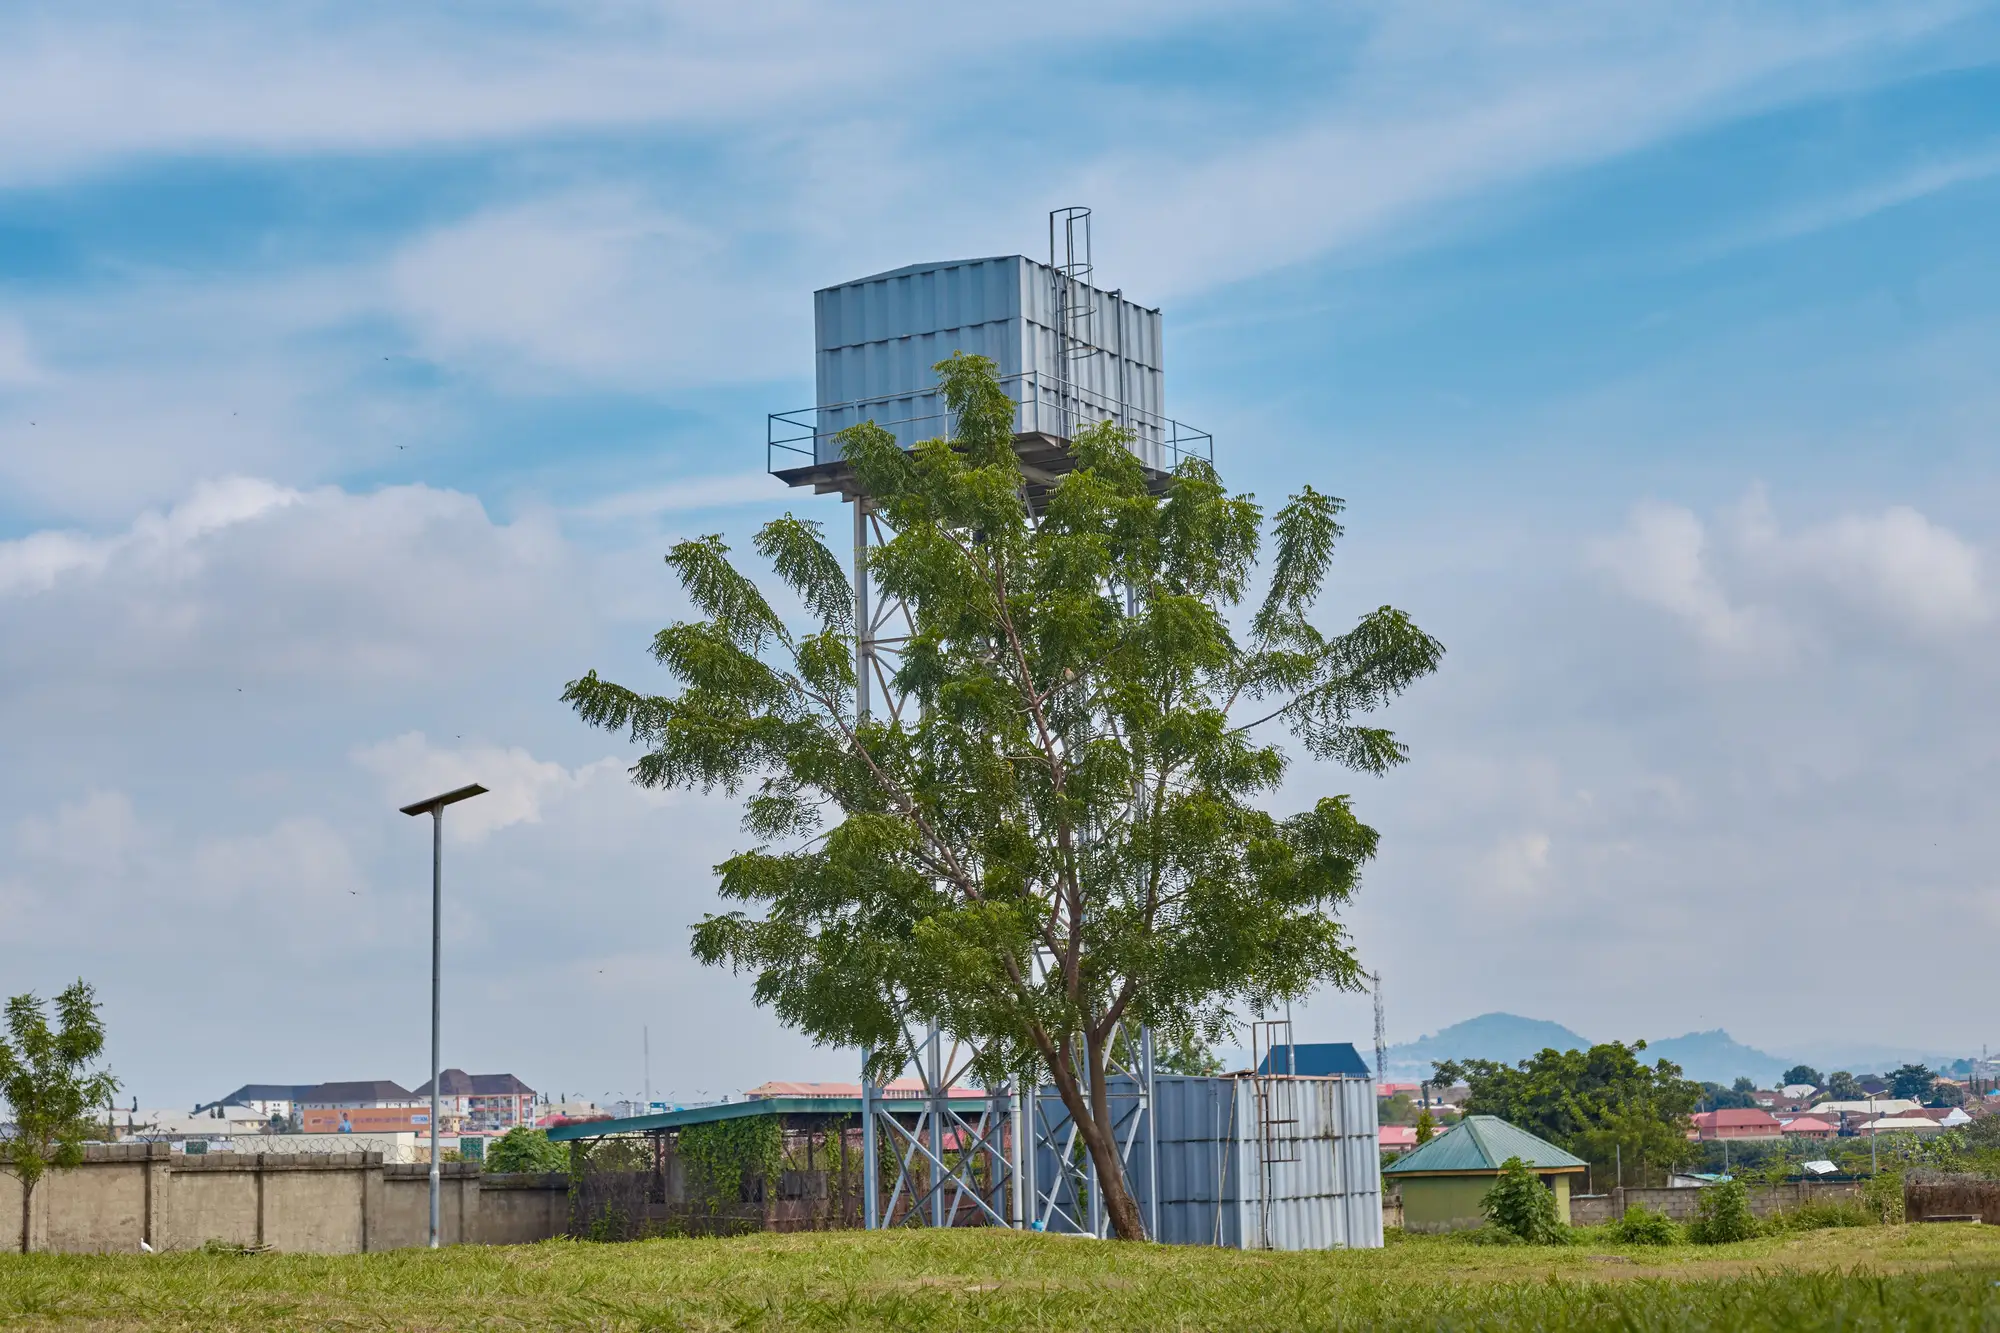
The number most people quote is 250 people per water point, drawn from the Sphere Handbook's water supply standards. It's the planning ratio used across almost every WASH proposal and donor logframe, and it's worth knowing where that number comes from before applying it to a district that doesn't match the Handbook's worked example.
The ratio itself
Sphere's water access standard sets a maximum of 250 people per tap stand, 500 people per hand pump, and 500 people per open well, alongside the more familiar 15 litres per person per day and a maximum walking distance of 500 metres to the nearest point. The per-point ratio exists because a tap or pump has a physical throughput limit. Past a certain crowd size, queuing times blow out, people start drawing from whatever's closer even if it's unprotected, and the standard stops matching what's happening on the ground.
None of these numbers are a design code. They're a floor for humanitarian response, built for displacement and emergency contexts where you're standing up water points fast and need a defensible minimum. A development programme planning borehole and latrine coverage over a multi-year horizon can, and often should, plan tighter than 250:1, especially where yield is marginal or a single pump already serves a sprawling, low-density settlement pattern.
Spacing is a separate question from headcount
The ratio tells you how many people one point can serve. Where that point should sit, how far apart two boreholes need to be, and whether the aquifer under your district can support the density you're planning for are separate questions. Borehole spacing comes down to hydrogeology: drawdown radius, recharge rate, and whatever the groundwater assessment for that catchment says about safe yield per borehole. Two boreholes 150 metres apart can be fine in a high-yield alluvial aquifer and a bad idea in fractured bedrock, where they draw down the same fracture.
This is where a lot of district plans go wrong. A team hits the 250:1 ratio on paper, satisfies the minimum standards water point ratio line in the proposal, and still ends up with clusters of pumps in the villages nearest the road and nothing in the settlements three hours' walk from the nearest track, because that's where the baseline survey happened to reach.
The baseline is usually the weak link, not the arithmetic
Applying any of this starts with knowing what's already out there. Before you can say a cluster of villages is under-served against the 250:1 ratio, you need an honest count of the boreholes, hand pumps, tank stands and latrine blocks that already exist in that district, not the subset that made it into the last NGO's handover report or the district water office's spreadsheet from four years ago. In places where ground survey hasn't reached every settlement, that count is usually the thing holding up the plan.
One way around a stale or patchy baseline is turning a single high-resolution satellite pass over the district into a dated, located inventory of every water and sanitation point the imagery picks up, so the ratio gets applied against what's actually standing in the landscape rather than what the last survey happened to log.
A rough way to use the numbers together
If you're sketching coverage for a district plan, a workable order of operations looks like this: inventory what exists, overlay population by settlement, flag any cluster where the existing point count puts the ratio above 250:1 (or 500:1 for pumps and wells), and only then bring in a hydrogeologist to check whether the gaps you've found are serviceable at that density given the local aquifer. Running it in that order keeps the Sphere ratio doing the one job it's meant for, flagging under-coverage, without asking it to also answer the harder engineering question of where the next borehole should go.
If the point count you're working from is the uncertain part of that equation, have a look at what Sanitation Mapping can tell you before the next field season starts.