Blog · 26 October 2026
What satellite imagery can and can't tell you about a borehole's yield
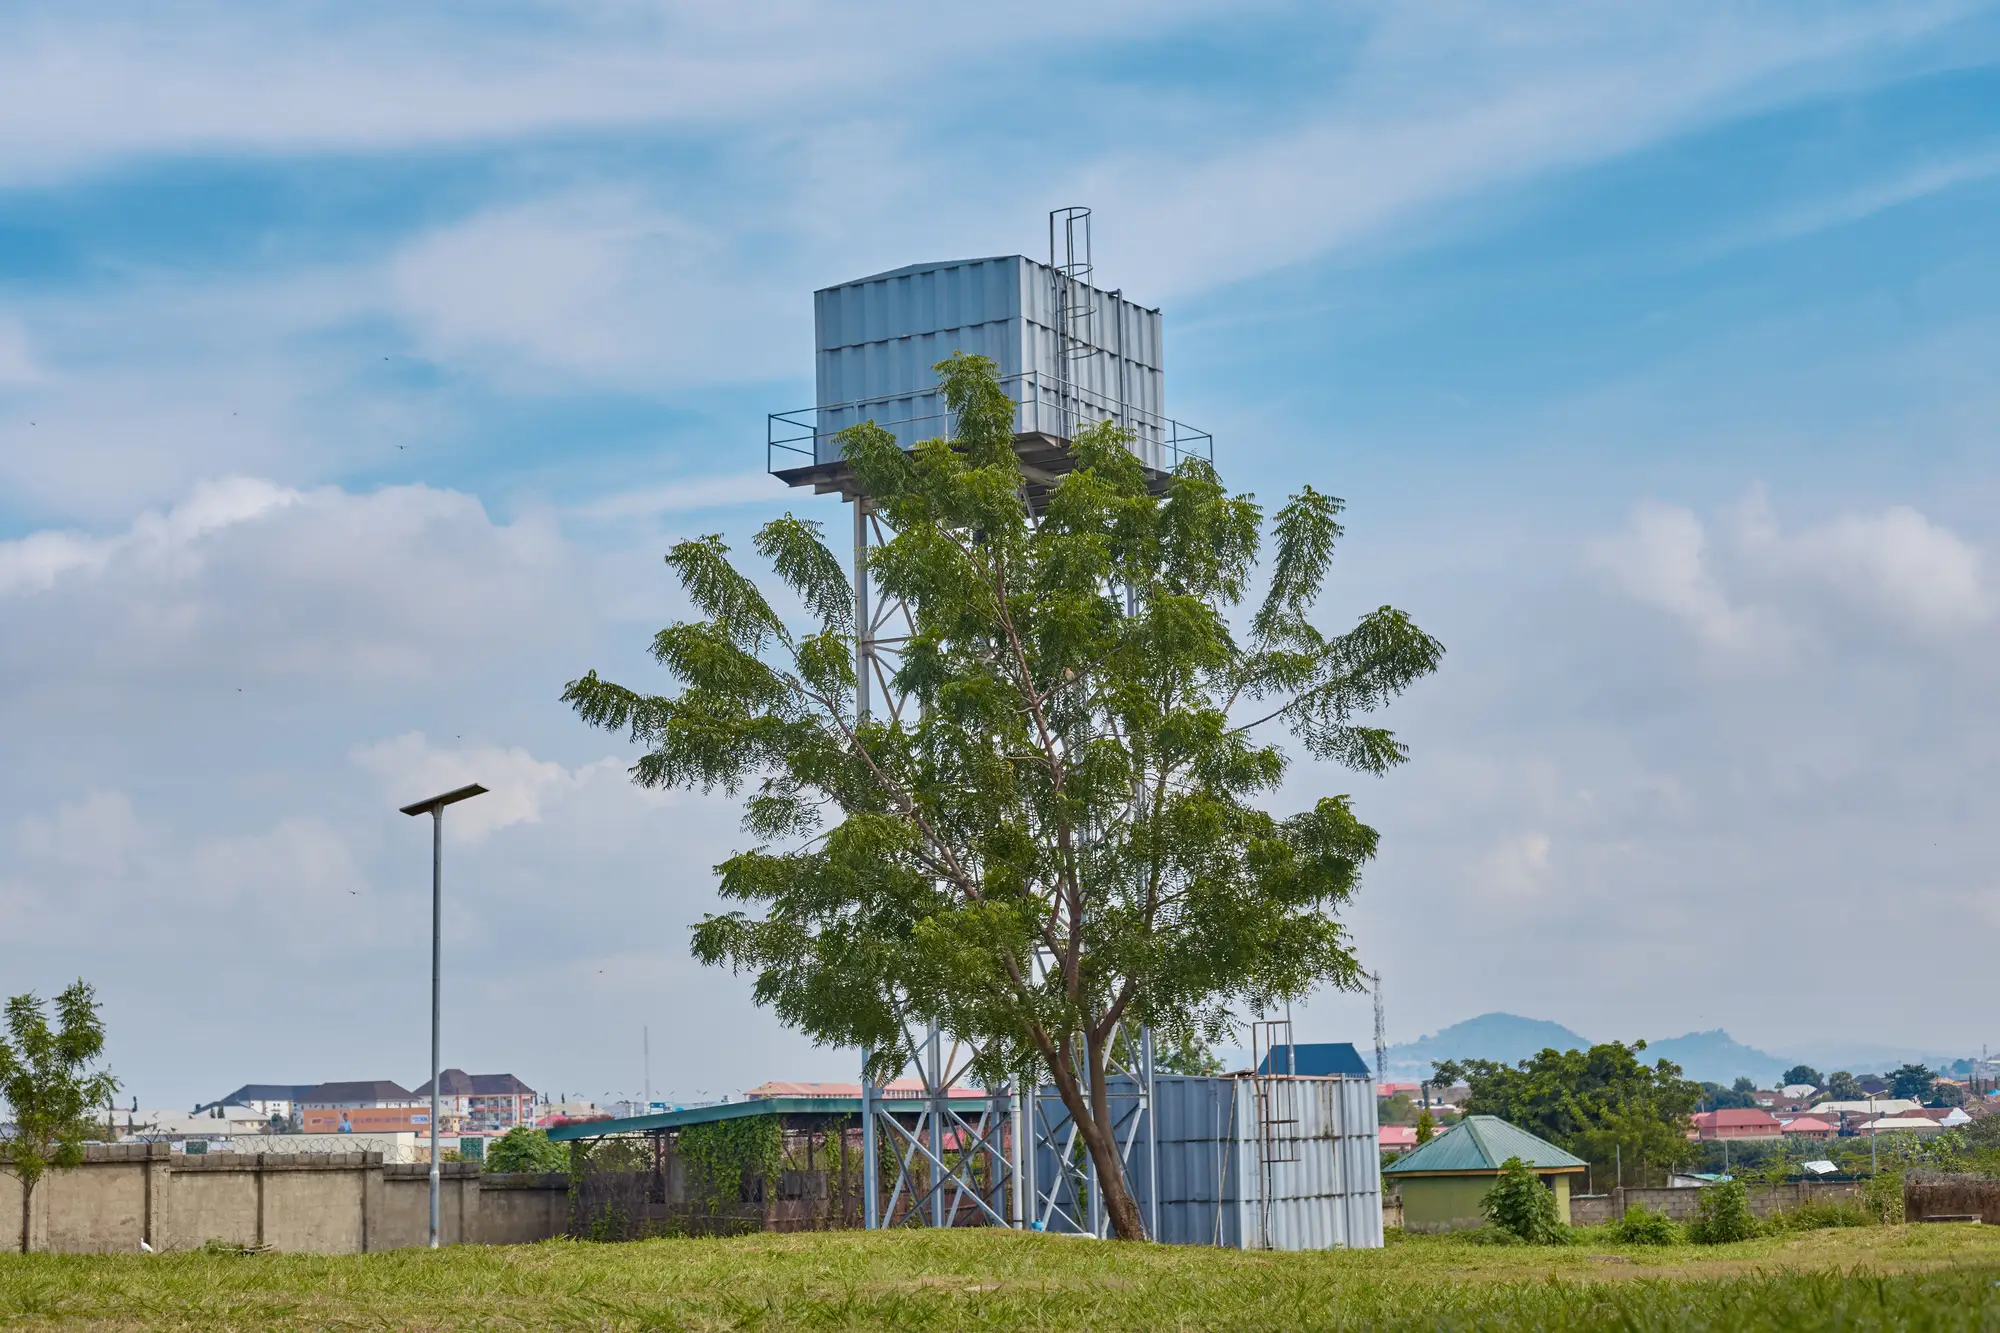
A borehole headworks looks like a borehole headworks from above, whether the pump is pulling 3 litres a second or the casing has been dry since March. That's the fact a lot of procurement conversations skip past, and it's worth being straight about before anyone builds a workplan around a satellite pass.
What actually shows up in the imagery
At 0.3 m resolution or finer you can pick out the physical footprint pretty reliably: the apron slab, the tank stand and its shadow, a pump house roof, sometimes the soak-away pit if it's been dug properly. You can often tell a protected hand-dug well from a drilled borehole by the apron shape and the fencing around it. You can see whether a tank stand has a roof on the reservoir or an open one, which matters for contamination risk assessments even if it has nothing to do with output.
Compare two passes a year apart and you can point to specific differences. A tank stand that's new since last year. An apron gone from clean concrete to cracked and choked with weeds, a reasonable proxy for abandonment. A cluster of standpipes near a school that wasn't fed before. None of that gives you a flow rate, but a cracked apron or a missing roof panel is worth sending someone to go look at.
Where the imagery stops being useful
Yield comes out of the aquifer, not off the ground surface. It's a function of transmissivity, storage coefficient, static water level, and how far the water table draws down under sustained pumping, none of which has a visible signature from a satellite pass or an aerial frame. A borehole producing 3 l/s and one that's been dry for two dry seasons running can sit fifty metres apart and look like identical dots on the image if the headworks are both intact.
This is the functionality-versus-yield distinction that trips up a lot of district-level planning. Functionality is something you can sometimes infer from physical condition: a missing pump handle, a tank with no water line staining, a footpath to the apron that's gone to grass because nobody's walked it in months. Yield is a number that comes out of a pump test, a drawdown reading, or a community simply telling you the queue now starts at 4am instead of 6am. Imagery gives you suggestive cues on the first. It gives you nothing on the second.
Dry borehole detection from imagery alone is mostly a myth worth retiring early. The things people point to as proxies, abandoned-looking apron, dead vegetation ring, absent footpath wear, correlate loosely with "nobody's using this" but not specifically with "this is dry" as opposed to "the pump broke" or "the community switched to a closer source." A dry borehole with an intact, well-maintained headworks (because the community keeps hoping, or because it was only recently drilled and just missed the aquifer) will look exactly like a producing one in the frame.
What this means for a district plan
None of this makes the imagery useless, it just sets the right job for it. The job is narrowing down where to send a field team first instead of walking a whole district on guesswork, not replacing the pump test. A dated inventory of every borehole, tank stand and latrine block visible on the current pass gives a team a prioritised list with coordinates attached, which is a different starting point than a district map from a 2019 survey with half the points already gone or relocated.
Sanitation Mapping builds exactly that inventory from one annual VHR pass, point-located and exportable as GeoJSON or CSV, so the field visit starts with a known set of structures to check rather than a blank district and a fuel budget. Run the yield test and functionality check once you know where the points actually are.